
A visitor clicks your ad. Pays to be there. Waits 6 seconds. Leaves.
You paid for that click. You lost the sale. Your site never even had a chance to make a case for itself.
This is the part of digital marketing that most business owners underestimate because it’s invisible. You can see when an ad campaign underperforms. You can see when email open rates drop. But slow load times bleed revenue quietly, in the background, across thousands of sessions a month, and most analytics dashboards don’t surface it clearly enough to trigger an alarm.
If you’re tracking revenue-level KPIs for your business, this breakdown of the metrics that actually matter is worth reading alongside this one. Page speed belongs in that conversation.
What the numbers say about speed and sales
Google’s own research tracked what happens to bounce rates as load time increases. Going from 1 second to 3 seconds raises the probability of a visitor leaving by 32%. At 5 seconds, it’s a 90% higher bounce rate. At 10 seconds, 123%.
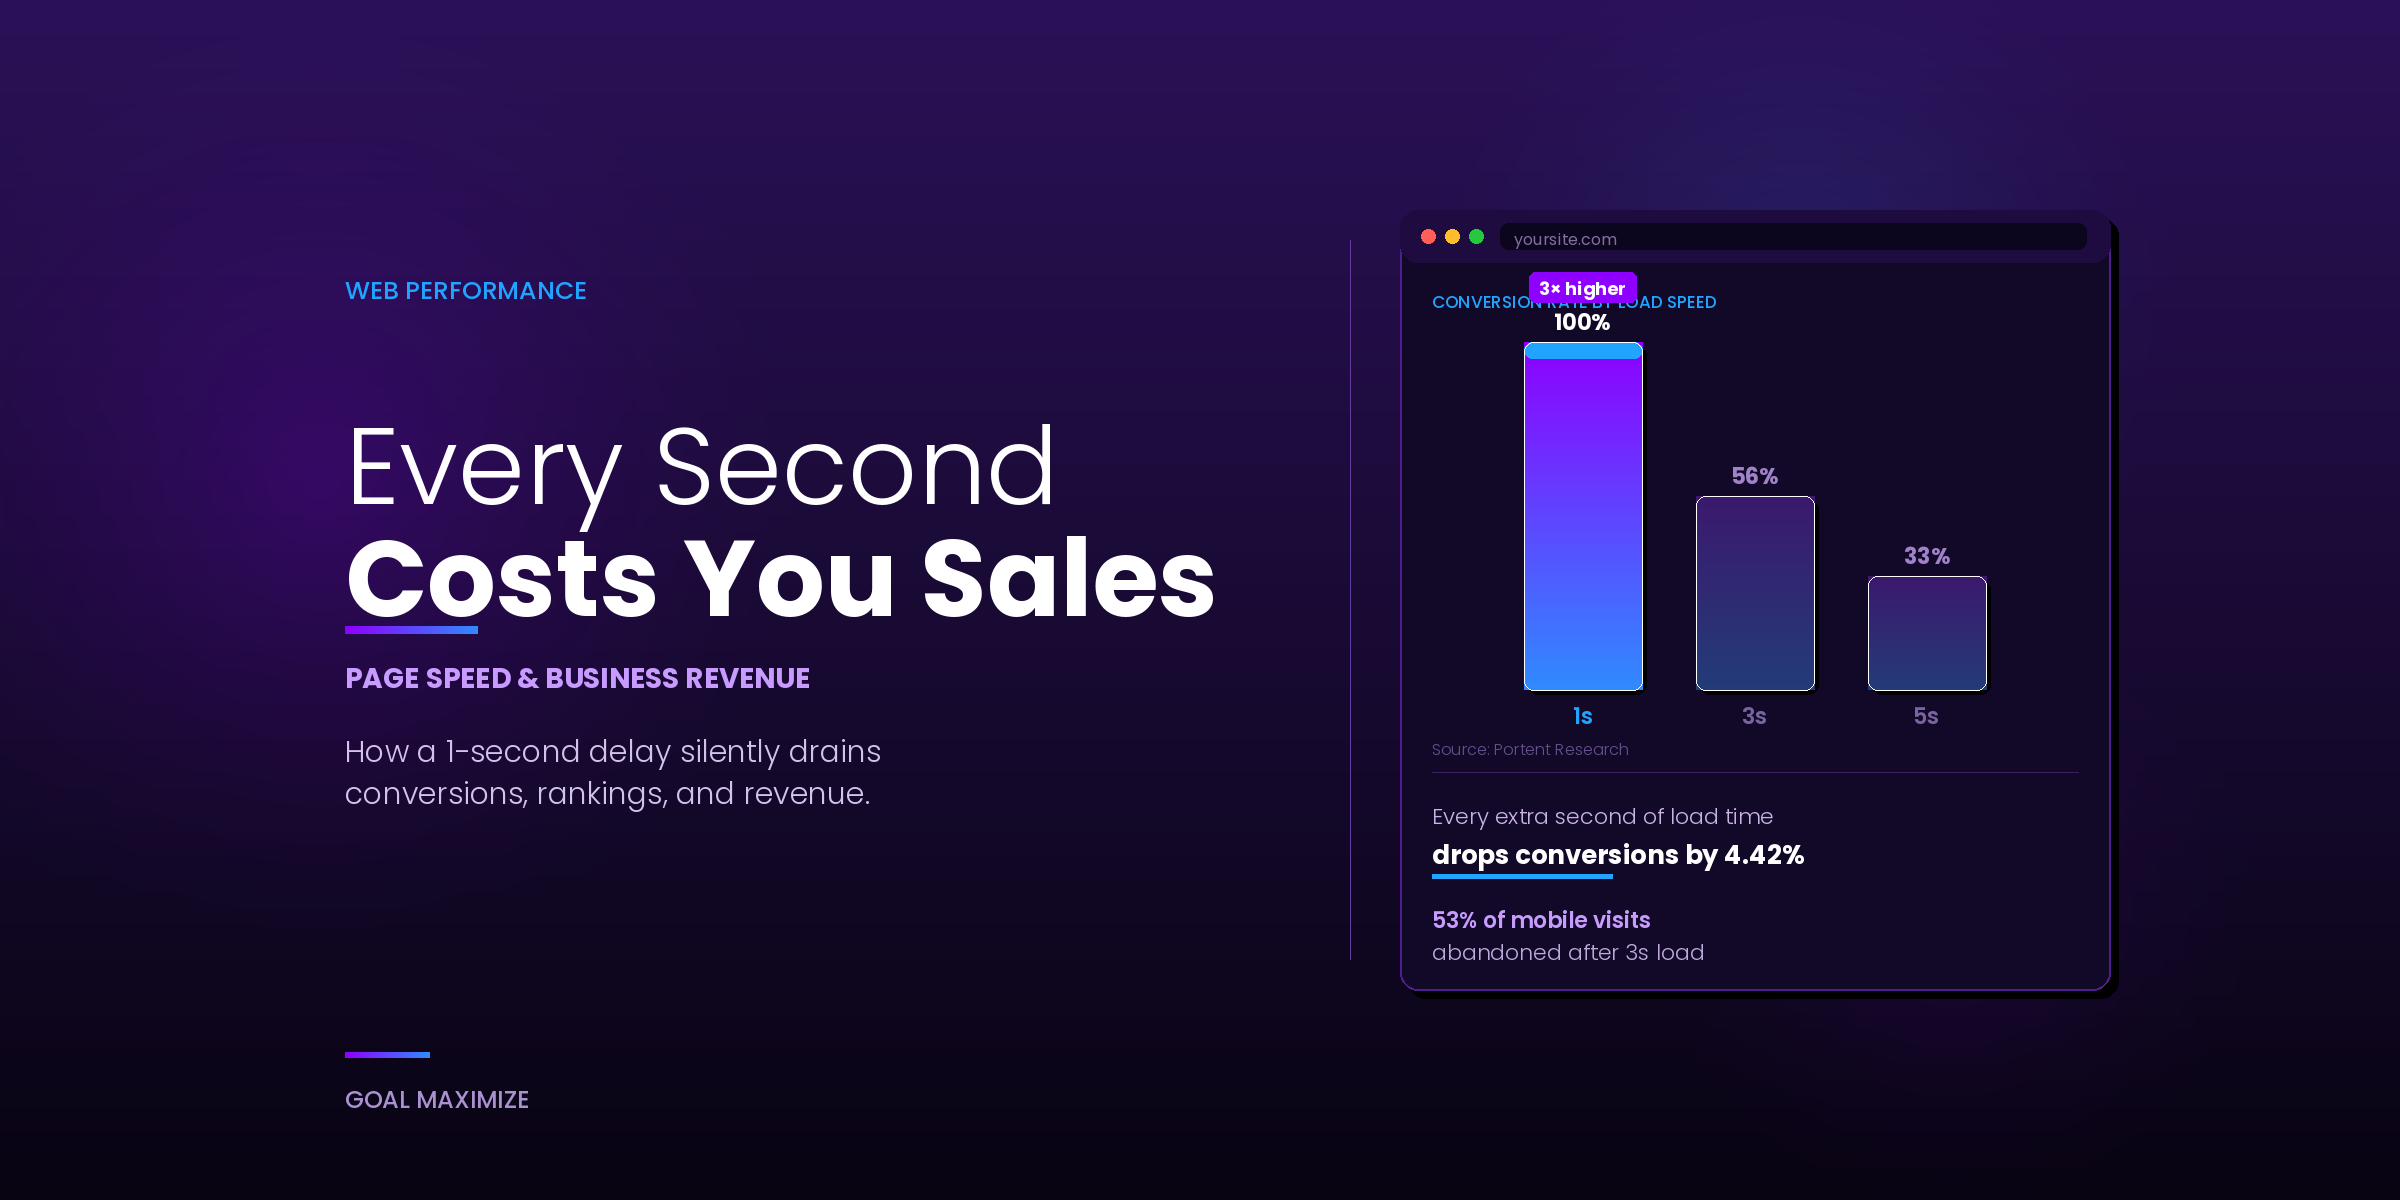
Portent ran a study specifically on conversion rates across load speeds. Sites loading in 1 second converted at nearly 3 times the rate of sites loading in 5 seconds. Each additional second of load time dropped conversions by an average of 4.42%.
Amazon once calculated that every 100 milliseconds of added latency cost them 1% in sales. That’s 100ms, less than a blink. The math scales down the same way for smaller businesses.
These aren’t projections or controlled experiments. They’re real session data from real users doing exactly what your visitors do: deciding in the first few seconds whether they’re staying or going.
What users experience vs. what you think they experience
Load time isn’t a single number. A page can technically “load” in 2 seconds while still feeling broken to the person using it.
Google measures this through Core Web Vitals, three metrics that capture the parts of loading that users actually notice:
Largest Contentful Paint (LCP) measures how long it takes for the biggest piece of visible content to appear, usually your hero image or main headline. Google’s threshold for a passing score is under 2.5 seconds. A lot of business sites fail this on mobile.
Interaction to Next Paint (INP) measures how quickly the page responds when someone clicks a button or taps a link. Under 200 milliseconds is the target. A page that looks loaded but doesn’t respond to clicks creates the specific kind of frustration that pushes people to close the tab.
Cumulative Layout Shift (CLS) measures whether elements jump around during loading. You’ve experienced this: you go to tap something, and it moves just as your finger lands. That’s a high CLS score in action. It breaks trust fast.
A site can score fine on load time in a vacuum and still fail all three of these for real users. The distinction matters because Core Web Vitals are what Google actually uses to measure page experience, and since 2021, they’re an official ranking signal.
The SEO problem nobody talks about
Slow sites don’t just lose visitors after they arrive. They get seen by fewer people in the first place.
Google has factored page speed into rankings since 2010. The 2021 Core Web Vitals update made the signal more specific and more meaningful. A site with poor performance scores is competing against faster sites for the same keywords, and the faster site has an advantage, all else being equal.
This creates a compounding effect. If you’re putting serious work into keyword research and optimization, slow load times are quietly eroding the results. You rank lower, get less traffic, and convert a smaller percentage of the traffic you do get. The same technical issue hurts you at both ends of the funnel.
Mobile is where most sites are actually losing
Desktop speeds are one thing. Mobile is where the real gap tends to live.
Over 60% of global web traffic now comes from mobile devices (Statcounter, 2024). Google found that the average mobile landing page takes over 15 seconds to fully load, and that 53% of mobile visits are abandoned if a page takes more than 3 seconds. Those two numbers together describe a serious structural problem across the web.
Mobile networks introduce variability that a wired desktop connection doesn’t. A page that loads fine in the office on fiber can load poorly for a user in a car on 4G. And most business websites were built without mobile performance as a first-order constraint.
Solid UI/UX design accounts for this from the start: image compression baked in, CSS kept lean, non-critical scripts deferred, and load behavior tested on real mobile connections, not just a throttled desktop browser.
Real businesses, real results
Vodafone improved their Largest Contentful Paint score by 31% and recorded an 8% increase in sales and a 15% improvement in lead-to-visit rate (Think with Google, 2021).
Rakuten 24, a Japanese e-commerce platform, worked with Google to bring its Core Web Vitals up to passing. The result was a 33.1% increase in revenue per visitor and a 53.37% improvement in conversion rate.
Furniture Village, a UK furniture retailer, improved load speed by 20% and saw a 10% lift in conversions alongside a measurable drop in bounce rate (Think with Google).
The pattern holds across sectors and business sizes. These aren’t cases where a company rebuilt its entire tech stack. They identified the technical bottlenecks, fixed the highest-impact ones, and measured what changed. The results were significant in each case.
Deloitte’s research backs this up at a granular level: improving mobile load speed by just 0.1 seconds lifted retail site conversions by 8.4% and increased average order value by 9.2%. A tenth of a second.
What actually slows a site down
Knowing what to look for matters if you’re going to prioritize fixes. The most common causes, roughly in order of how often they show up:
Images that haven’t been compressed or converted. A full-resolution photo at 4-5MB is one of the fastest ways to tank load time. Modern image formats like WebP cut file sizes by 25-35% compared to JPEG without visible quality loss. Most CMS platforms support WebP now with no custom development required.
Too many plugins and third-party scripts. Every plugin on a WordPress site adds HTTP requests. Marketing tags, chat widgets, and analytics scripts fire on load and compete for bandwidth. It’s not uncommon to audit a business website and find 12-15 scripts loading on every page visit, several of which are from tools that haven’t been used in months.
Hosting that isn’t suited to the traffic. Shared hosting puts your site on a server with hundreds of others, all competing for the same resources. Performance is unpredictable and often inadequate. The right CMS architecture and hosting setup shape how well a site performs under real traffic conditions.
No caching in place. Without caching, the server builds every page fresh for every visit. Object caching, browser caching, and a CDN reduce time-to-first-byte substantially, especially for returning visitors. This is one of the better-value fixes because it affects every page on the site simultaneously.
Render-blocking scripts. JavaScript or CSS files that load before any content appears force the browser to wait. Deferring non-critical scripts and loading them asynchronously can shave a full second or more off perceived load time with no visible change to the page.
E-commerce carries the most direct exposure
For e-commerce businesses, the stakes are higher because the math is simpler. A visitor lands on a product page with purchase intent already formed. A slow page interrupts that intent at the worst possible moment, right before the decision.
The Deloitte numbers cited above came specifically from retail. And the pattern shows up consistently in platform-level data from Shopify, BigCommerce, and others: session duration, add-to-cart rate, and checkout completion all correlate with page speed in ways that make performance a direct revenue variable.
For any business building or relaunching an e-commerce site, speed requirements should be written into the project brief before development begins, not audited after launch. The e-commerce launch checklist covers what that looks like in practice.
How to check where your site stands right now
Google’s PageSpeed Insights tool (pagespeed.web.dev) is free, takes about 30 seconds, and gives you a scored breakdown of your site’s performance on both mobile and desktop. A score of 90 or above is the target. Most unoptimized business websites score somewhere in the 40-70 range on mobile. Some score lower.
The report flags specific issues by estimated impact, which means you can see immediately which fixes will move the needle most and prioritize accordingly. Addressing 3-4 of the top items often moves a site from failing to passing without touching the entire codebase.
Speed isn’t separate from everything else you’re doing
If you’re running paid campaigns, your landing page speed affects your Google Ads Quality Score, which affects what you pay per click. If you’re investing in email marketing, every click-through lands on a page that either converts or doesn’t. If you’re building organic traffic through SEO, slow pages rank lower and convert fewer of the visitors who do arrive.
Page speed is one of the few technical factors that touches every channel at once. Fixing it doesn’t just improve one metric. It improves the return on everything else you’re doing.
The Website Design and Development Guide goes deeper into how performance, architecture, and conversion design connect.
Some performance fixes are straightforward enough to handle without a developer: image compression, removing unused plugins, installing a caching plugin. Others need proper development work to do right. If your site is scoring poorly and you’re running ad spend or SEO investment to it, the ROI on fixing the performance issues is almost always better than adding more budget to campaigns landing on a slow page.
If you want a proper technical audit and a clear list of what to fix first, our web development team can run that for you and turn it into an actionable plan.

**Shalini Thakur** is an SEO Specialist at Goal Maximize with 9+ years of experience in technical SEO, content strategy, and AI-powered search optimization. Specializes in data-driven SEO strategies, website optimization, content development, and adapting websites to the evolving AI-powered search landscape.