
A $14,000 Monthly Ad Budget, and Nobody Could Say Whether It Was Working
That was the situation a regional home services company found itself in last year. The marketing director had dashboards full of charts, weekly reports from the agency, and a Google Analytics account with 90 days of data she had never opened. Traffic was climbing. Social followers were growing. The CEO kept asking one question she could not answer: “How many of these clicks turned into paying customers?”
She is not unusual. Most businesses collect marketing data. Very few track the specific digital marketing KPIs that connect spending to revenue. The rest are flying blind with a fuel gauge that shows “somewhere between empty and full.”
This piece covers the marketing metrics to track if you want to stop guessing and start making budget decisions based on numbers that actually correspond to money coming in the door. If you are still working through what a full digital marketing program looks like at a high level, start there first and come back here when you are ready to measure it.
The Difference Between a Metric and a KPI (And Why Your Reports Probably Blur the Two)
Page views are a metric. So are impressions, followers, and email list size. They describe activity. They do not describe outcomes.
A KPI, on the other hand, answers a question the business cares about. How much does it cost to acquire a customer? Are those customers worth more than what we paid to get them? Which channel is producing the most revenue per dollar spent?
The confusion between the two is one reason so many agency relationships go sideways. A monthly report showing 200,000 impressions and 15,000 website visits looks impressive until someone asks what happened after those visits. That is also why the questions you ask before signing with an agency should include how they define success, and which digital marketing performance indicators they plan to report on.
Here is a simple test: if improving a number does not change a budget decision, a staffing plan, or a revenue forecast, it is a metric. If it does, it is a KPI. Track both. Report on the KPIs.
7 KPIs That Belong in Every Marketing Review
Customer Acquisition Cost (CAC)
Take everything you spent on marketing last month: ad dollars, agency retainers, software subscriptions, the portion of your team’s salaries dedicated to marketing. Divide that by the number of new customers acquired. That is your CAC.
The number itself is meaningless in isolation. A $400 CAC is terrible for a coffee subscription company and perfectly fine for a B2B software firm closing $60,000 annual contracts. What makes CAC useful is watching it over time and comparing it against customer lifetime value. More on that in a moment.
One thing that trips businesses up: blending paid and organic CAC into a single number. A company spending heavily on both SEO and PPC needs to separate the two, because the whole point of organic investment is to drive CAC down over time. Blending hides whether that is actually happening.
Customer Lifetime Value (CLV)
CLV estimates the total revenue one customer generates across the entire relationship. For a subscription business, that calculation is fairly clean: average monthly revenue multiplied by average customer lifespan in months. For project based businesses, it gets messier, but even a rough estimate is better than none.
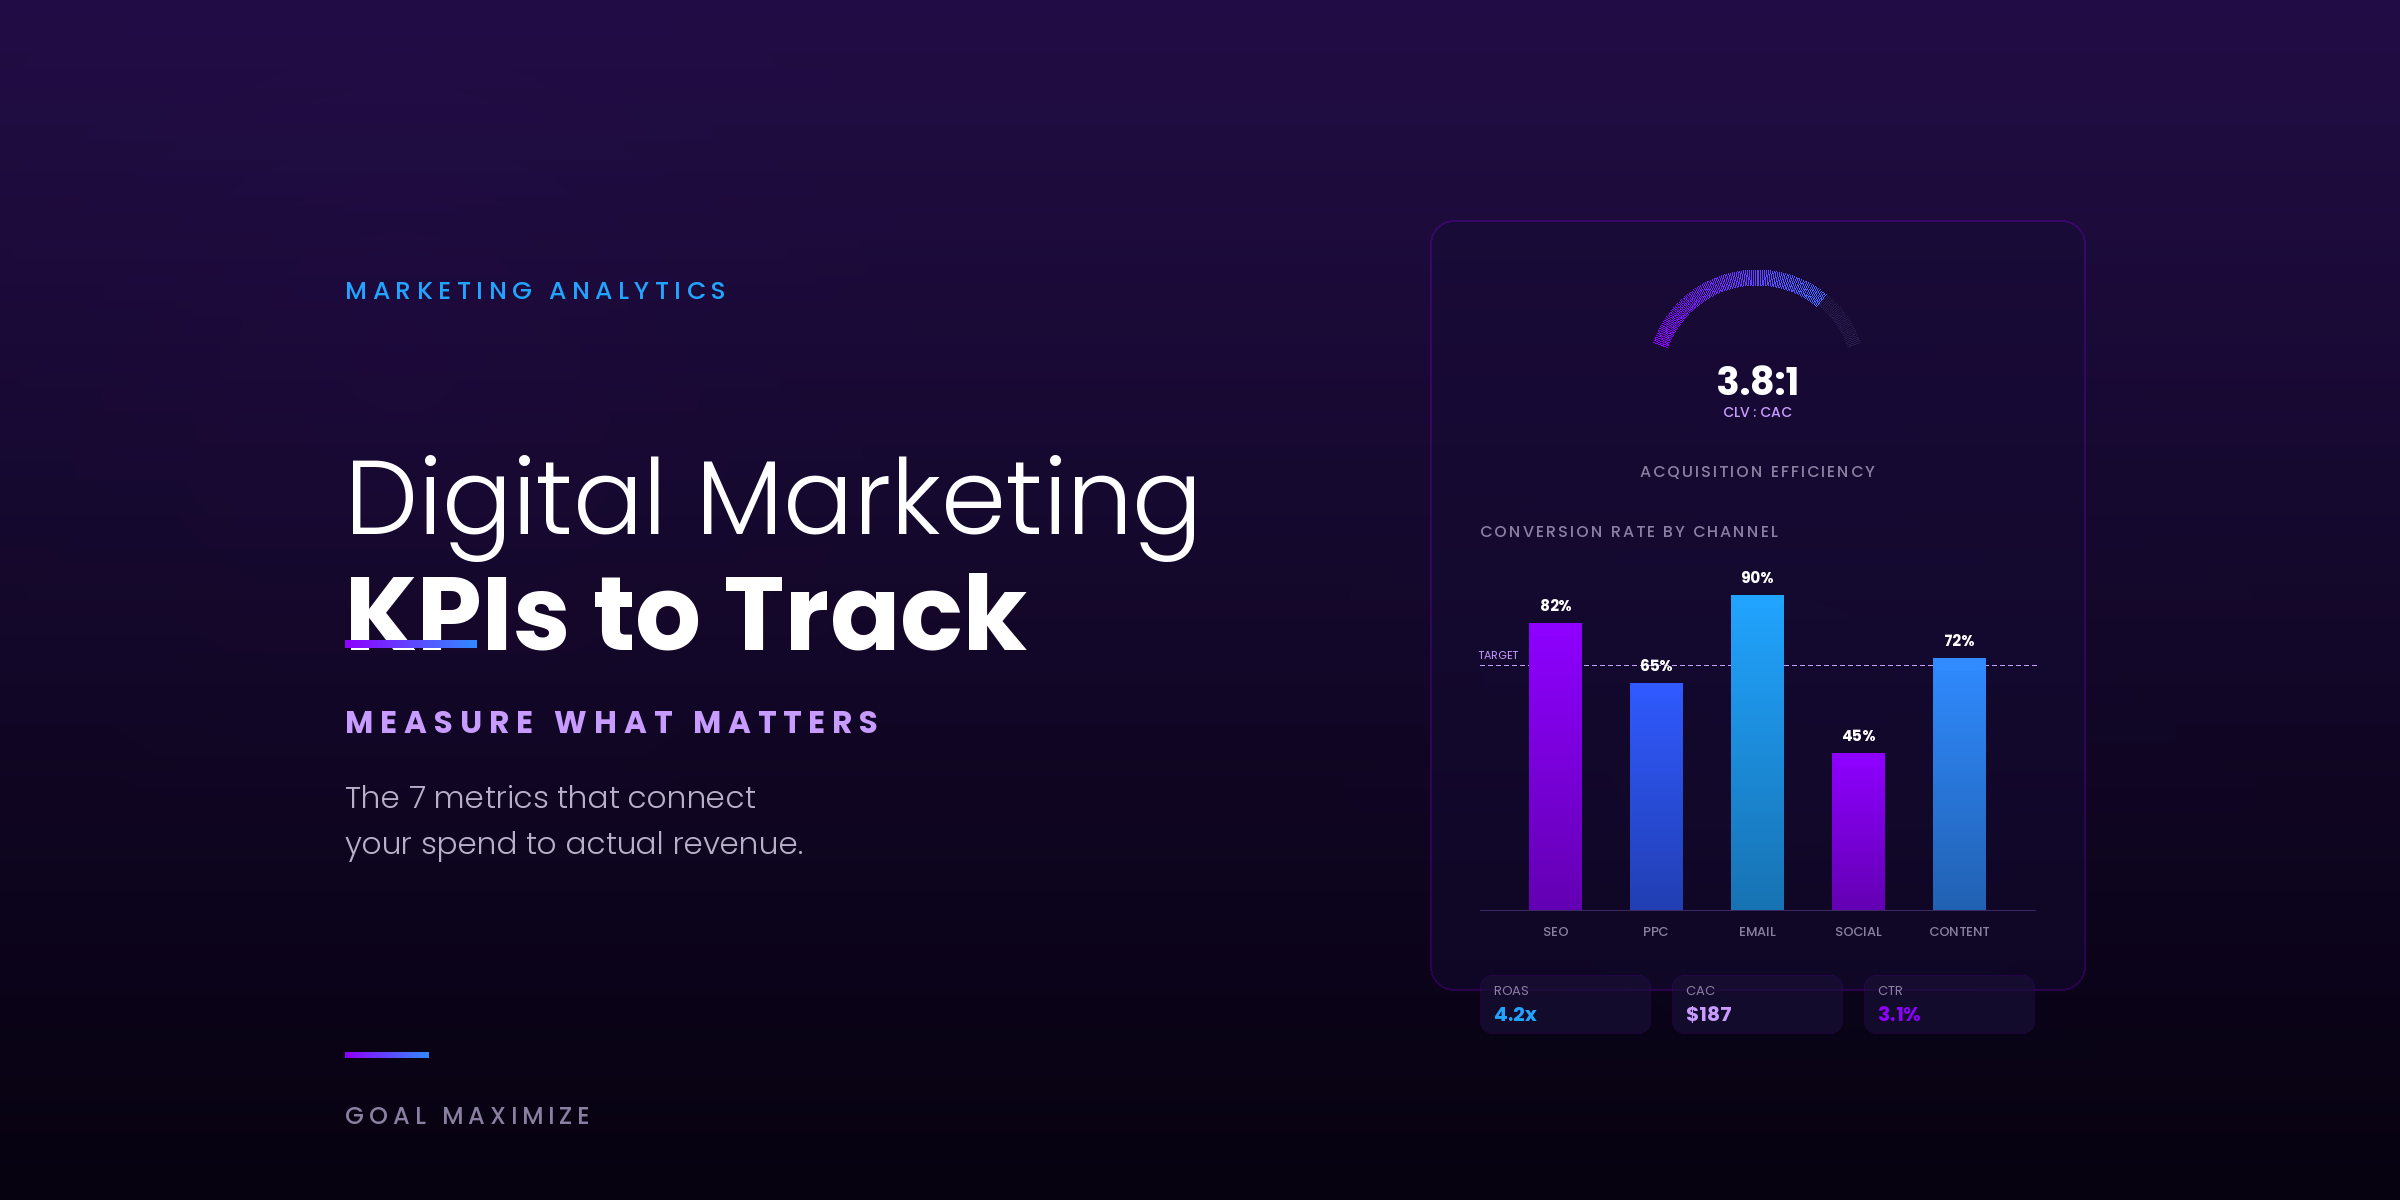
The ratio between CLV and CAC is where strategy lives. Below 2:1, acquisition costs are eating margins. Between 3:1 and 5:1 is the sweet spot for most industries. Above 5:1 often means you are underinvesting in growth and a competitor with deeper pockets will eventually notice the opening.
Conversion Rate (by Channel, Not Sitewide)
Here is where most businesses make their first tracking mistake. They look at the overall website conversion rate (say, 2.8%) and either celebrate or worry. That single number hides almost everything useful.
Break it apart. What is the conversion rate for organic search visitors versus paid? What about visitors who land on the blog compared to those who land on a product page? A DTC brand that tracked this breakdown discovered organic search visitors were converting at 4.1% while social media traffic converted at 0.6%. That one insight redirected $3,500 in monthly ad spend toward content production and SEO, and within a quarter, overall revenue climbed without any increase in total budget.
Return on Ad Spend (ROAS)
ROAS tells you how many dollars of revenue each advertising dollar produced. A 4:1 ROAS means $4 back for every $1 spent. Simple enough.
The trap is treating it as the only paid media KPI. ROAS does not account for product margins, shipping costs, or returns. A campaign generating 6:1 ROAS on a product with 15% margins might actually be losing money after fulfillment. Pair ROAS with CAC and you get a much clearer picture of whether paid campaigns are profitable, not just busy.
Organic Traffic That Converts
Raw organic traffic numbers are satisfying to watch grow, but the metric that matters is organic sessions leading to a conversion event: a form fill, a purchase, a phone call. Plenty of pages rank well and attract thousands of monthly visitors who bounce within seconds because the content does not match their intent.
An SEO audit built around conversion data often uncovers pages ranking on page 1 for informational queries that generate zero leads, while commercial intent pages sit on page 3 with no optimization. Fixing that misalignment usually delivers faster revenue impact than chasing new keywords from scratch.
Email Click Through Rate and Revenue Per Send
Open rates used to be the default email KPI. After Apple’s Mail Privacy Protection started pre-loading tracking pixels in 2021, open rate data became inflated and unreliable for a significant portion of subscribers. CTR and revenue per email sent are harder to game and more directly connected to outcomes.
Tracking revenue per send is especially telling for ecommerce. If a promotional email generates $1,200 in revenue from a list of 8,000, that is $0.15 per send. Running that calculation across campaigns over time reveals which types of emails (abandoned cart, product launches, seasonal promotions) consistently produce the best return, and whether email is still delivering the ROI the channel is known for.
Lead to Customer Close Rate
This is the KPI that sits at the intersection of marketing and sales, and it is the one most often ignored because neither team wants to own it. Marketing generates 500 leads. Sales closes 15 of them. Is that a 3% close rate because the leads were poor quality, or because the sales process has gaps?
Tracking this number by lead source answers the question. If SEO leads close at 8% and paid social leads close at 1.5%, marketing knows where to double down and sales knows which leads to prioritize. Without this metric, both teams operate on gut feel and finger pointing.
The Quick Reference
| KPI | What It Answers | Healthy Range | Where the Data Lives |
|---|---|---|---|
| CAC | Can we afford to keep growing? | CLV:CAC ratio of 3:1 or better | Ad platforms + CRM + finance |
| CLV | Are customers worth the acquisition cost? | 3x to 5x CAC | CRM + billing system |
| Conversion Rate | Is our traffic doing anything useful? | 2% to 5% (segment by channel) | GA4 + landing page tools |
| ROAS | Are ads generating more than they cost? | 4:1+ (check against margins) | Google Ads, Meta Ads Manager |
| Organic Conversions | Is our SEO investment paying off? | Upward trend quarter over quarter | GA4 + Search Console |
| Email CTR / Revenue per Send | Are subscribers engaging and buying? | CTR 2% to 5%; track $/send trend | ESP (Klaviyo, Mailchimp, etc.) |
| Lead to Close Rate | Are we attracting the right leads? | Varies; compare by source | CRM (HubSpot, Salesforce) |
3 Reporting Mistakes That Make Good Data Useless
Averaging everything together. A sitewide conversion rate of 3% can mask the fact that product pages convert at 9% while blog posts convert at 0.4%. Segment by channel, page type, and audience. The averages are comforting; the segments are where the decisions live.
Reporting monthly with no trend line. A single month’s numbers are a snapshot. Two months is a coincidence. Three months is a trend. Without trend context, every dip triggers panic and every spike triggers premature celebration. Plot at least 6 months of data before drawing conclusions about what is “working.”
Letting attribution default to last click. When a customer finds you through a blog post, comes back via a retargeting ad, opens 3 emails, and finally converts through a direct visit, last click attribution gives all the credit to the direct channel. That makes your content and email programs look like they contribute nothing, which leads to exactly the wrong budget decisions. GA4’s data driven attribution model is not perfect, but it distributes credit more realistically than last click.
So You Have the KPIs. Now What?
Numbers on a dashboard do not improve marketing performance. Decisions do. The point of tracking digital marketing KPIs is to answer 3 recurring questions at every monthly or quarterly review: Where should we spend more? Where should we spend less? What is broken in the funnel, and what would fixing it be worth in revenue?
That home services company from the opening? Once the marketing director started tracking CAC by channel and conversion rate by landing page, the answer became obvious. Their highest spending channel (paid social) had the worst CAC by a factor of 4. Their lowest spending channel (local SEO combined with Google Business Profile optimization) was producing leads at one fifth the cost. The reallocation took about 2 weeks to implement. The impact showed up within 60 days: 35% more leads at 28% lower total cost.
None of that required a bigger budget. It required better measurement.
If your reports are full of charts but light on answers, the issue is probably not a data shortage. It is a KPI problem. Start with the 7 metrics above, segment them by channel, review them monthly, and tie every finding to a specific action.
Need help building the tracking infrastructure or making sense of what the numbers are telling you? Talk to the Goal Maximize team about a marketing analytics setup that connects spend to outcomes.

**Shalini Thakur** is an SEO Specialist at Goal Maximize with 9+ years of experience in technical SEO, content strategy, and AI-powered search optimization. Specializes in data-driven SEO strategies, website optimization, content development, and adapting websites to the evolving AI-powered search landscape.