
Every SEO manager has lived through this meeting. You open a deck showing 40 keywords that climbed into the top 10, average position improving month over month, a nice green trendline. The CEO looks at it for 4 seconds and asks, “So how much of our pipeline came from this?”
Silence. Because the report answered a question nobody in the room was asking.
SEO reporting fails at the executive level for one reason: it gets built for practitioners and then handed to decision-makers. Rankings, crawl stats, and backlink counts are diagnostic tools. They tell you whether the work is progressing. They don’t tell a CEO whether the budget was worth spending. This guide covers what to put in front of leadership instead, how to structure it, and how to connect organic traffic to revenue without pretending you have attribution you don’t.
Why Rankings Alone Are a Weak Report
Rankings still matter. They’re just a poor headline metric, for a few reasons worth being honest about:
- Results are personalised. Position 3 for you might be position 7 for a user in another city on a different device.
- The SERP keeps changing shape. AI overviews, People Also Ask, local packs, and shopping modules push traditional results down. Rank 1 doesn’t own the screen it used to own.
- Not all rankings are worth money. Climbing to position 2 for a term nobody searches with buying intent is a vanity win.
- Executives can’t act on them. “We moved from 14 to 9” doesn’t lead to a decision. “Organic leads grew 22% quarter over quarter” does.
The framing that works: rankings are an input. Traffic, leads, and revenue are outputs. Leadership funds outputs.
Start by Asking What Your CEO Actually Cares About
Before you rebuild anything, sit with whoever signs off on the budget and get answers to 3 questions:
- What business goal is SEO supposed to support this year? More qualified leads? Lower cost per acquisition? Entering a new market?
- What does a “good month” look like in numbers they already track?
- Which decisions will this report inform? Whether to increase spend, hire, or shift budget between channels?
Most SEO reporting problems are translation problems. The work is fine; the language doesn’t match how leadership thinks. When we take over reporting for a client, this one conversation reshapes the dashboard more than any tooling change does.
The SEO Metrics for Executives That Actually Land
Here’s the short list of SEO KPIs worth putting in front of a leadership team, roughly in order of how much they care.
1. Organic Revenue or Pipeline Contribution
The number that ends the “is SEO working” argument. For ecommerce, pull revenue from organic sessions directly. For B2B or services, report qualified leads sourced from organic and multiply by your average deal value and close rate. It’s an estimate, and that’s fine, so label it as one. A defensible estimate beats no revenue number at all.
2. Organic Conversions and Conversion Rate
Form fills, calls, demo requests, purchases. Split branded from non-branded where you can, because non-branded conversions are the ones SEO genuinely earned. Track the rate too, because if traffic doubles while conversion rate halves, you’re attracting the wrong visitors.
3. Non-Branded Organic Traffic
Branded search mostly reflects your marketing spend everywhere else. Non-branded organic traffic is the closest thing to a clean measure of whether your SEO is reaching new demand. Report it separately or the number flatters you.
4. Cost Per Acquisition vs Paid
This is the slide that protects your budget. Divide total SEO investment by organic conversions, then set it beside your paid CPA. Organic usually costs more upfront and far less over time, which is exactly the comparison a CFO understands. We break the trade-off down further in our comparison of SEO vs PPC and which delivers better ROI.
5. Share of Voice in Your Category
How visible you are across your commercial keyword set compared to named competitors. Executives are competitive. “We passed Competitor B on 60% of our priority terms” gets attention that an average-position chart never will.
6. Top Landing Pages by Business Value
Not by sessions. Rank pages by conversions or revenue so leadership sees which content is doing commercial work, and where more investment would pay.
Everything else, including crawl errors, Core Web Vitals, backlink velocity, and indexation, belongs in an appendix or a separate technical review. It matters enormously to the work. It just isn’t a board conversation. For the broader cross-channel view, our guide to digital marketing KPIs every business owner should track covers how these sit alongside paid, email, and social metrics.
A Sample SEO Analytics Dashboard Layout
Structure beats volume. A dashboard leadership actually reads fits on one screen and follows a top-down logic: outcome first, then explanation, then detail. Here’s a layout that works, whether you build it in Looker Studio, a spreadsheet, or a slide.
| Section | What Goes In It | Why It’s There |
|---|---|---|
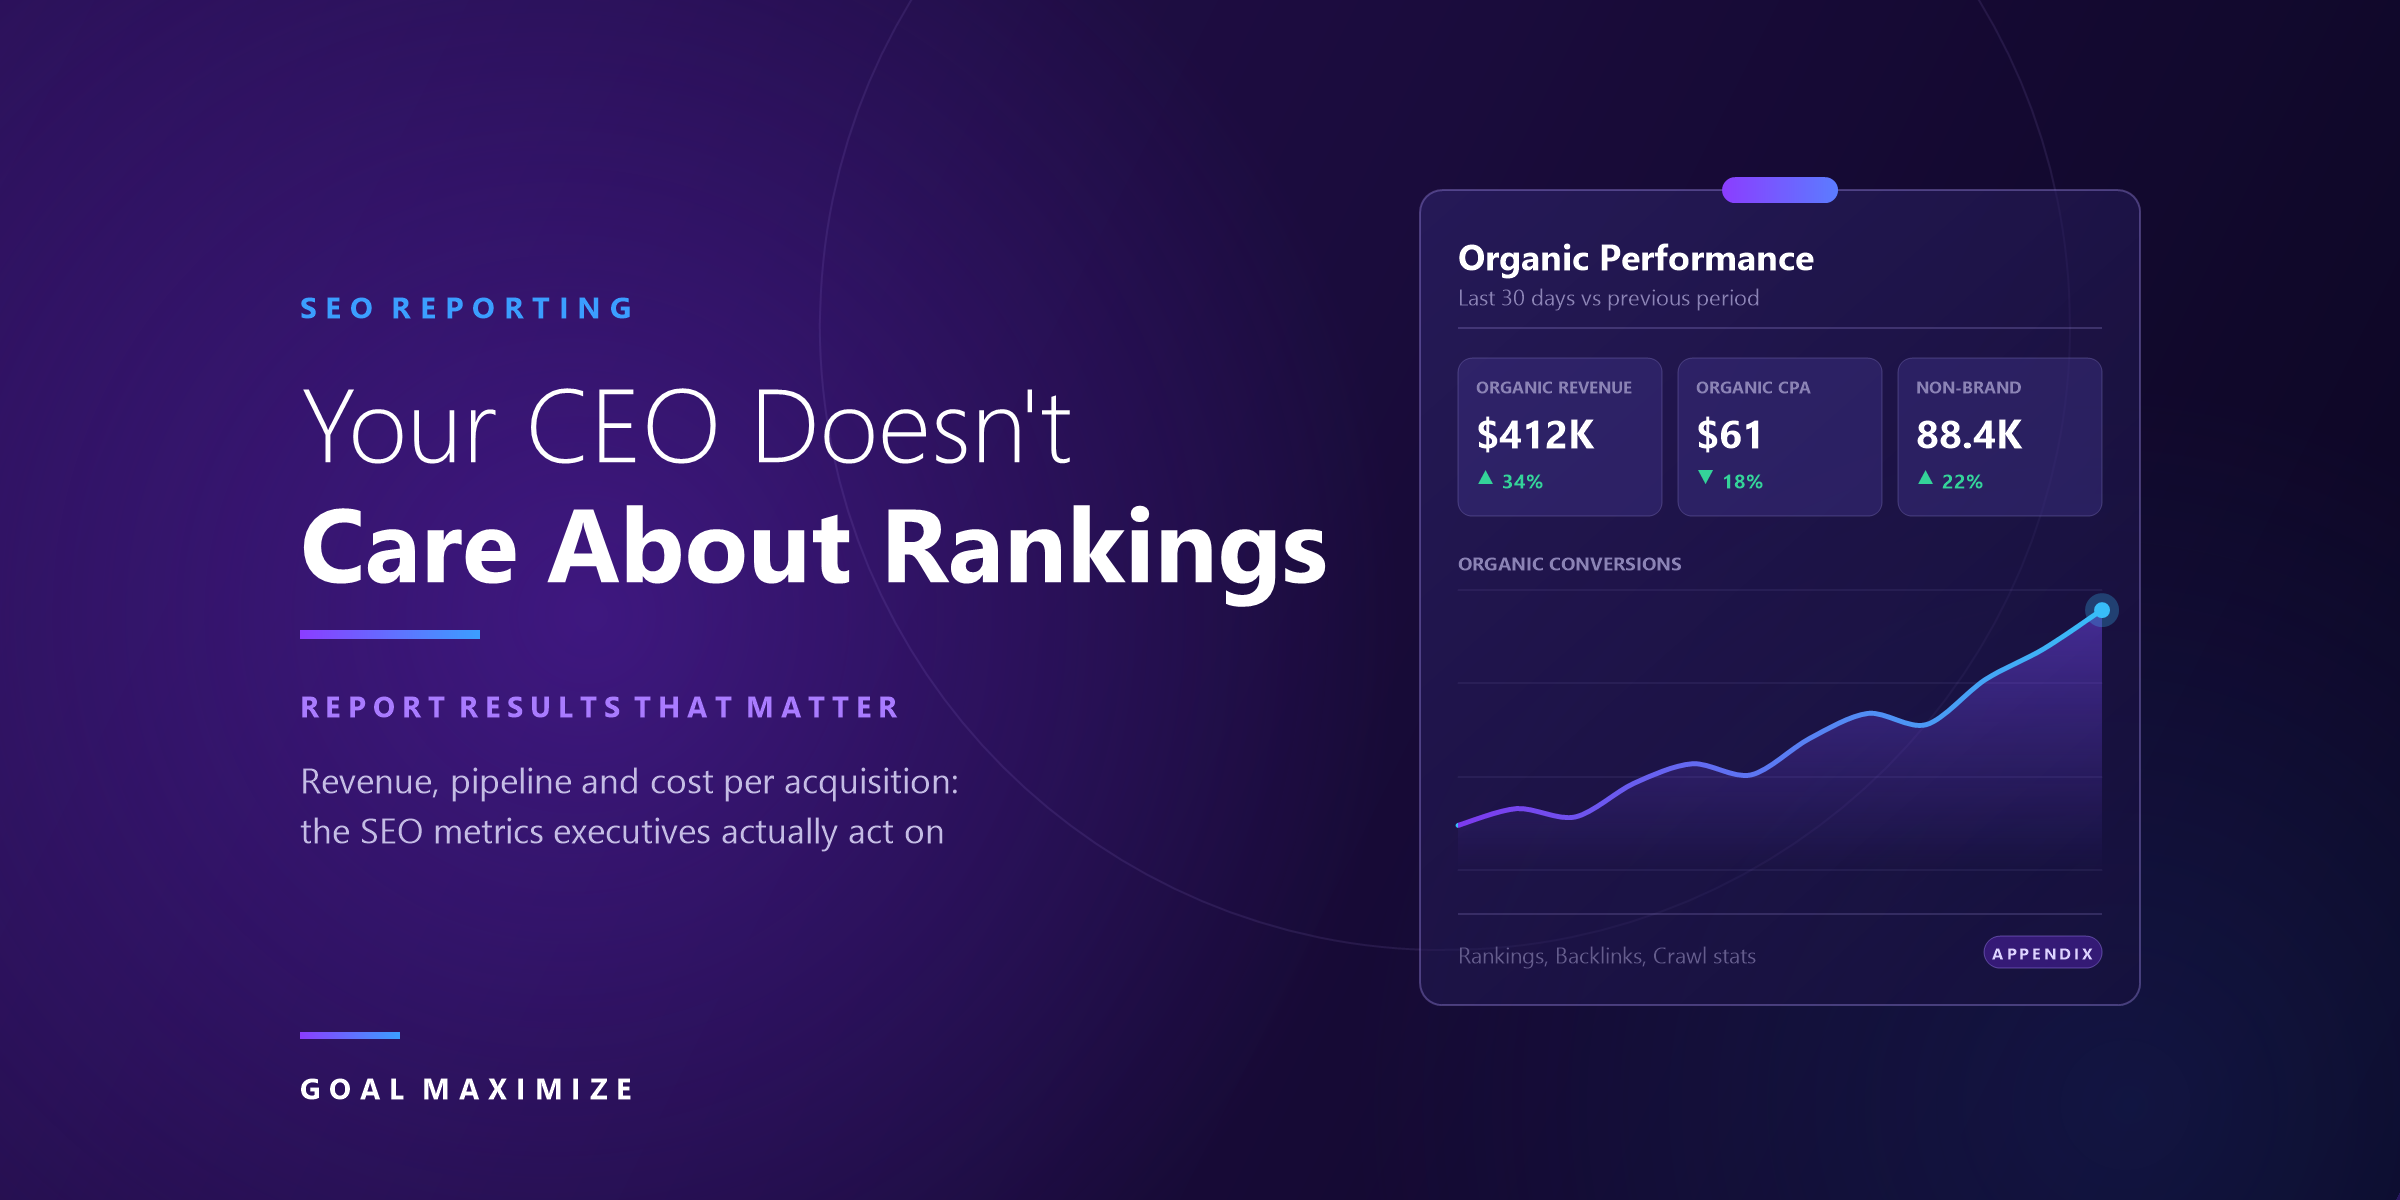
| Row 1: Headline scorecard | Organic revenue or pipeline, organic conversions, non-branded sessions, organic CPA. Each with % change vs last month and last year. | The 10-second answer. If they read nothing else, they’ve got the story. |
| Row 2: Trend view | A 13-month line chart of organic sessions and conversions, annotated with launches, algorithm updates, and site changes. | Shows direction and seasonality, and pre-empts “why did June dip?” |
| Row 3: Where growth came from | Top 10 landing pages by conversions, branded vs non-branded split, new vs returning organic users. | Turns the headline number into something explainable. |
| Row 4: Competitive position | Share of voice vs 3 to 5 named competitors, keyword visibility by funnel stage. | Context. Growth means little without knowing if the category grew too. |
| Row 5: What we did and what’s next | 3 bullets on work shipped, 3 on next month’s priorities, plus anything blocked. | Connects spend to activity and sets expectations. |
| Appendix | Rankings, technical health, backlinks, crawl and indexation stats. | Available on request. Never the opening slide. |
Two rules keep this readable. Always show comparison periods, because a raw number with no baseline is meaningless. And annotate your charts, because a dip nobody explains gets remembered as a failure, while a dip labelled “site migration, week 2” reads as expected.
How to Connect Organic Traffic to Revenue
This is where most reporting stalls, usually because the tracking underneath was never set up for it. A workable sequence:
- Define conversions that mean something. A newsletter signup and a demo request shouldn’t sit in the same bucket. Separate micro from macro conversions in GA4.
- Assign values. If a demo request closes 20% of the time at an average deal size of $8,000, that lead is worth $1,600. Now every organic conversion carries a number.
- Pass the source into your CRM. Capture the original channel on the lead record so sales outcomes can be traced back. Without this you’re guessing.
- Close the loop monthly. Match closed deals back to organic-sourced leads and report actual revenue, not just projected.
- Use a sensible attribution model. Last-click undervalues SEO badly, since organic often does the early research work. Data-driven or position-based models are fairer to it.
Be upfront about the gaps. Some conversions happen offline, some users research on mobile and buy on desktop, and no model captures all of it. Executives trust a report that names its own limits far more than one claiming perfect precision.
Reporting can only measure what the site is capable of converting. If organic traffic grows but conversions don’t, the problem often sits in page experience rather than the SEO, something we cover in how page speed affects business revenue.
How Often Should You Report?
Different audiences need different rhythms:
- Weekly (internal team only). Rankings, technical alerts, indexation, live campaign progress. Nobody outside the team needs this.
- Monthly (marketing leadership). The full dashboard above, with commentary on what moved and why.
- Quarterly (executives and board). Revenue contribution, CPA vs other channels, competitive position, and the ask for next quarter.
Reporting SEO to a CEO monthly is often counterproductive anyway. Organic compounds over quarters, so a 30-day window mostly shows noise and invites reactive decisions.
Reporting Mistakes That Cost Teams Their Budget
- Leading with vanity metrics. Impressions and total sessions look impressive and explain nothing.
- Hiding bad months. Losses surface eventually. Explaining a dip yourself buys more credibility than burying it.
- Reporting activity instead of outcomes. “Published 12 blog posts” is a timesheet, not a result.
- Dumping raw tool exports. A 40-tab Semrush export isn’t a report, it’s homework you handed to your boss.
- Changing metrics every month. Swapping KPIs to whatever looks best destroys trust in the whole report.
- No commentary. Numbers without interpretation force executives to draw their own conclusions, and they’re rarely the ones you want.
Building the Reporting Habit
Good SEO reporting isn’t a monthly scramble. Set the KPIs once with leadership sign-off, automate the data pull so nobody rebuilds a spreadsheet by hand, and spend your actual effort on the commentary, the part software can’t do.
Reporting also gets easier when the underlying strategy has a clear shape. If your programme is a collection of disconnected tactics, no dashboard will make it look coherent. Our SEO Growth Playbook lays out how the pieces sequence over a 6 to 12 month horizon, which in turn tells you what to measure at each stage. And if the numbers are flat because the site itself is hard for search engines to read, start with the technical fixes that stop Google finding your website before rebuilding your reporting.
Final Takeaway
Your CEO isn’t dismissive of SEO. They’re dismissive of a report that doesn’t answer their question. Move rankings to the appendix, lead with revenue and cost per acquisition, show the trend with context, and say plainly what you’ll do next. The work doesn’t change, the conversation about it does, and that’s usually what determines whether the budget survives the next planning cycle.
Want reporting that survives a leadership meeting? Our search engine optimization services include executive-ready dashboards built around your revenue goals, not our activity. See Our Reporting Dashboard.

**Shalini Thakur** is an SEO Specialist at Goal Maximize with 9+ years of experience in technical SEO, content strategy, and AI-powered search optimization. Specializes in data-driven SEO strategies, website optimization, content development, and adapting websites to the evolving AI-powered search landscape.